The most popular apps of 2019
We welcome some apps to the spotlight for the first time. Lucidchart and GitHub join the top 15 most popular apps by number of customers. In popularity by active unique users, Zoom and UltiPro join the ranks of top apps, and G Suite pushes ahead of Salesforce. In both our popularity rankings (by number of customers and number of users), Office 365 takes the lead and G Suite comes in fourth. G Suite shows slightly faster year-over-year growth, increasing its number of customers by 37%, versus Office 365’s 36% customer growth. Looking at active unique users, G Suite’s year-over-year growth stands out at 50%, while Office 365 has experienced 38% user growth.
The fastest growing apps
Our fastest growing apps and integrations feature six data- or security-focused tools which are new to the top ranks: Snowflake, Atlassian Opsgenie, Google Cloud Platform, Splunk, Looker, and Envoy. Snowflake lands at the top of the heap with a whopping 273% growth year over year. And video conferencing favorite Zoom sets some new records.
In a special update, we also look at whether or not being a fastest growing app correlates to a company’s success. Our #1 fastest growing over the past five years — Slack (a double winner), Zoom, Jamf, and KnowBe4 — have all gone on to do big things, securing growth equity or going public.
Happiness with app-iness
Demand for app diversity continues to grow. This year, the average number of apps per customer reached 88, up from 83 apps a year ago. And now 10% of our customers deploy a substantial 200 apps or more.
We also looked at whether deploying Office 365 means customers commit to an exclusively Microsoft environment. The answer is increasingly “no”: the overlap of companies that deploy Office 365 but also invest in best-of-breed apps continues to grow. This year, nearly 78% of Okta’s Office 365 customers have adopted one or more best-of-breed apps. 32% deploy Zoom and 31% deploy Slack, in addition to Office 365. Customers increasingly invest in multiple bundles: over 30% of Okta’s Office 365 customers now deploy G Suite as well.
App-idextrous: tools we use for work and play
We looked at the most popular developer tools, HR tools, and video conferencing deployments at the corporate level to see what companies select for their workforces. The Atlassian Product Suite is the clear choice of developers; HR teams are still choosing Workday, but BambooHR has moved up to the second spot; and Zoom blows away the video conferencing space.
We also like to see what tools users choose to integrate into their daily lives, whether paying bills, planning trips, taking online classes, or donating to charitable causes. For this, we expand our scope to include apps that employees adopt as personal apps through Okta, in addition to those assigned by IT.* In the online learning space, Lynda.com content propels LinkedIn Learning to a strong first place. In the banking and finance realm, PayPal holds the top spot, growing in parallel with major banking institutions. Travelers are partial to the consolidated rewards programs that is now Marriott Bonvoy, but Airbnb checks in close behind. Uber still sets the pace for ground transportation. American Airlines has overtaken incumbent Southwest. And we see that travelers are increasingly turning to one-stop trip planning apps, such as TripIt and Expedia.
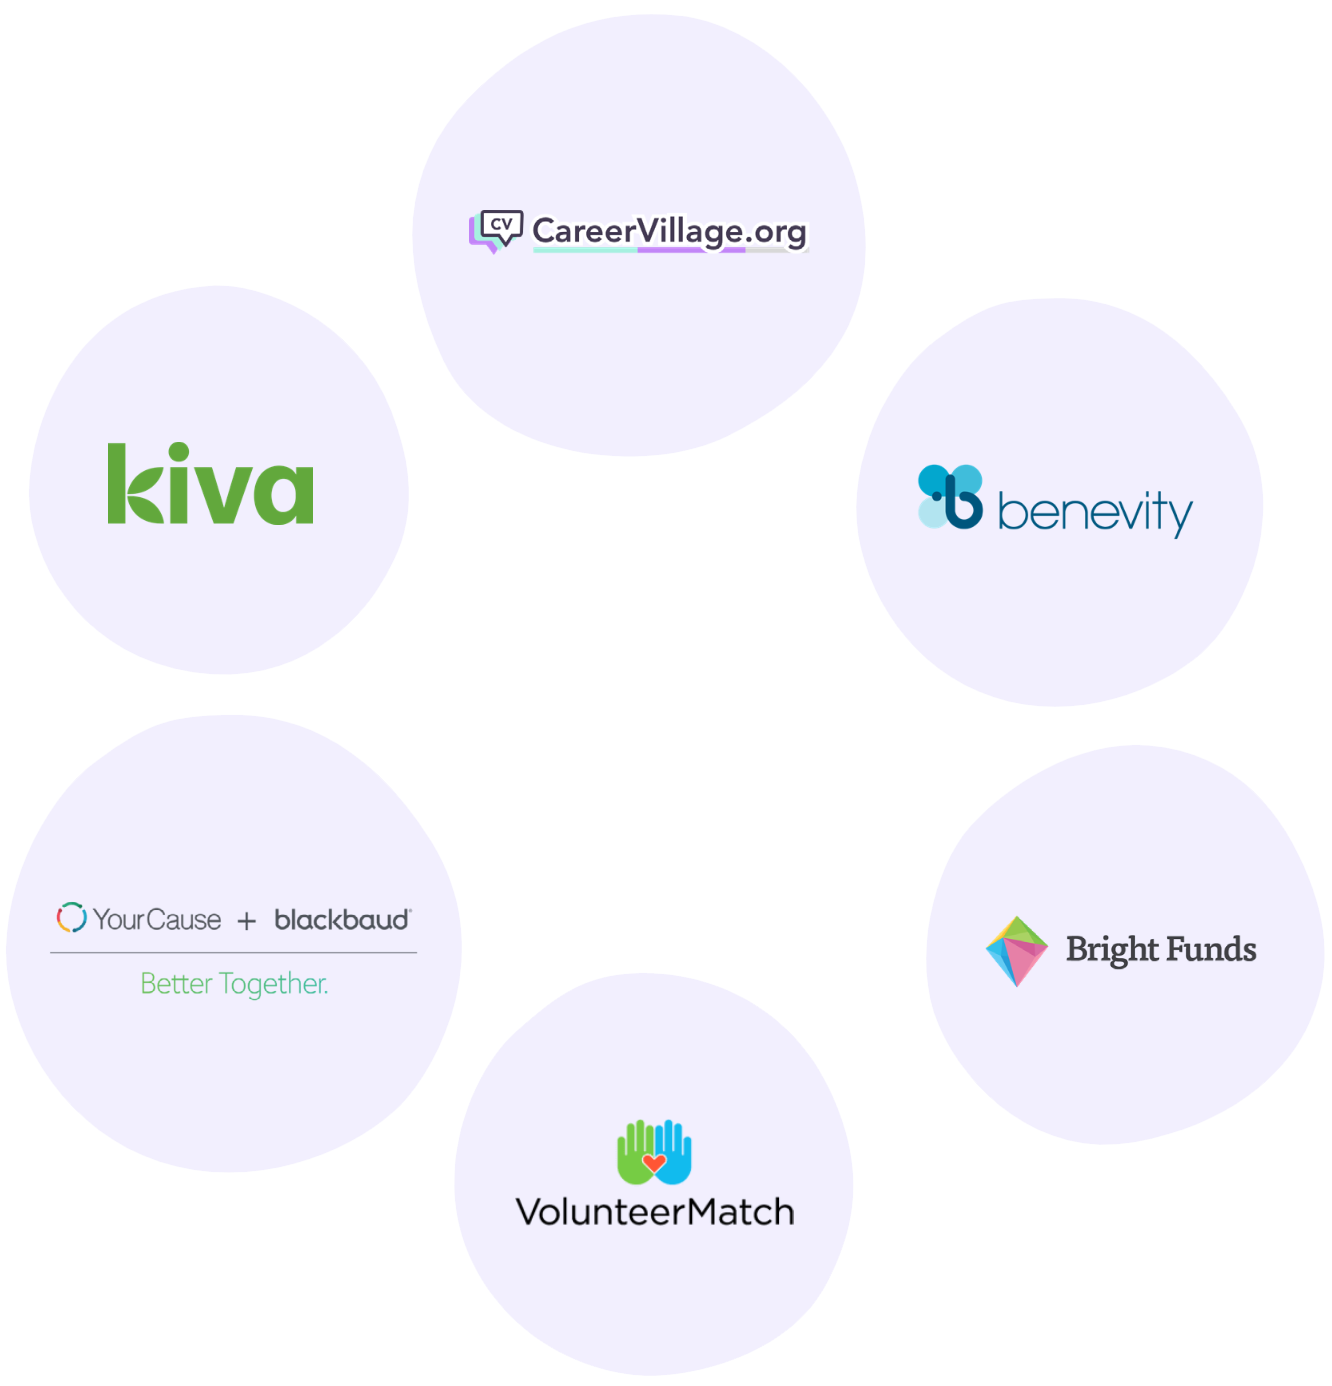
When it comes to social impact solutions, CareerVillage is currently the most popular App for Good among Okta customers, followed by Kiva. Customers also deploy Benevity, YourCause, BrightFunds, and VolunteerMatch.
* Consistent with the rest of our Businesses @ Work report, all data is anonymized.
Not your grandmother’s security stack
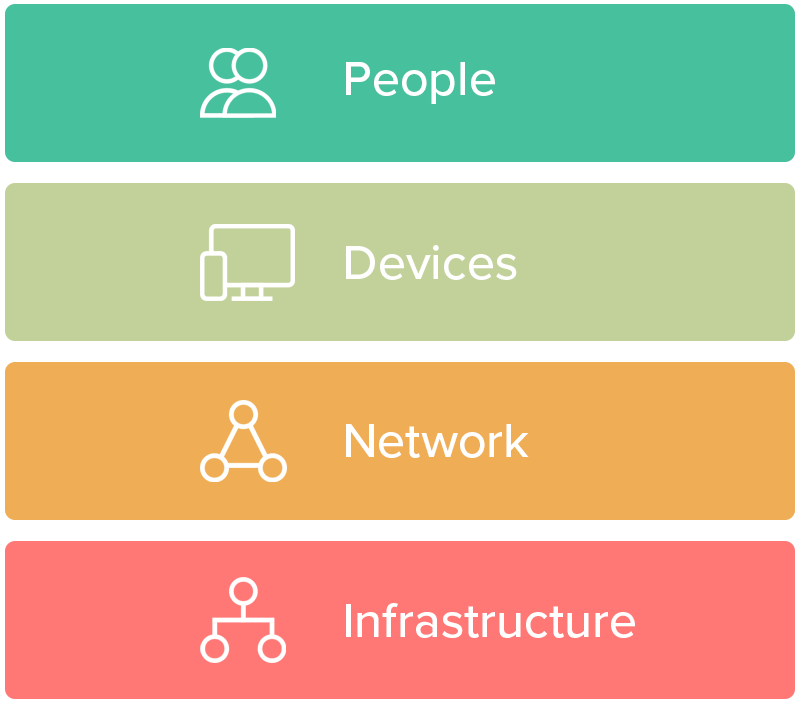
Security teams are adjusting to changing dynamics in the IT and threat landscapes. Companies are increasing their investments in security tools across the board. Looking at our network, we see companies deploying over 150 unique tools that we identify as security-focused. We divide these tools into a “modern security stack,” with four strategic layers, defined by what the tools are designed to protect: 1) people, 2) devices, 3) infrastructure, and 4) network. When customers adopt their first security tool, more than one third start with a tool from the people layer. Within the people layer, the fastest growth is coming from password managers, at 84% year-over-year growth. But overall, the infrastructure layer is seeing the fastest year-over-year growth, at 61%. The two most-adopted security tools — KnowBe4 and Mimecast — focus on email security against phishing attacks.
Factor check: newer customers want fewer, stronger factors
Customers are deploying multiple factors in addition to, or instead of, passwords. Use of Okta Verify (including Okta Verify with Push notifications) is on the rise, from 70% two years ago to 78% today. SMS and security questions are on the decline. For the first time since we’ve tracked factor deployment, we see a downward shift in the distribution of the number of factors deployed. We dug into the data to discover that the migration toward fewer factors is being significantly driven by newer customers — those that have been using Okta for less than one year. Of these newer customers, 39% deploy only one factor, but it tends to be a more secure factor: 71% are deploying Okta Verify. Newer customers deploy a simpler, stronger factor experience.
The MVPs of SDKs
C# and Java rank as the most popular tools used to build customer identity solutions. In a recent poll of over 100 of our customers, 89% reported they are currently building custom apps, and 81% report having an internal team that works on application development.
How did Okta create this report?
To create our Businesses @ Work reports, we use anonymized Okta customer data from our network of thousands of companies, applications, and IT infrastructure integrations, and millions of daily authentications and verifications from countries around the world. Our customers and their employees, contractors, partners, and customers use Okta to log in to devices, apps and services, and leverage security features to protect their sensitive data. Our customers span every major industry and vary in size, from small businesses to enterprises with hundreds of thousands of employees or millions of customers. As you read this report, keep in mind that this data is representative of Okta's customers, the applications we connect to through the Okta Integration Network, and the ways in which users access these tools through our service.
We have worked carefully to standardize our data. Unless otherwise noted, this report presents and analyzes data from November 1, 2018 to October 31, 2019, which we refer to as “this year,” “today,” and “in 2019.” Similarly, when we refer to “last year” or “in 2018,” we are referring to data from November 1, 2017 to October 31, 2018. “2017” refers to the same period in its respective year.
Unless otherwise specified, the data included in this report is limited to Okta customers that have deployed at least one app through the Okta Integration Network. Also, unless otherwise noted (see App-idextrous: tools we use for work and play), this report looks at apps deployed for corporate use.
Each year, we look at app popularity two different ways: first, by number of customers with an app deployed, and second by the number of active unique users, defined as users who have logged into an app via Okta at least one time in the past 30 days.
Most Popular Apps by Number of Monthly Active Unique Users
Average Number of Apps per Customer
Note: Data includes Okta Integration Network (OIN) and non-OIN, personal and corporate apps.
Okta's Office 365 Customers with Best-of-Breed Apps over Time
- Salesforce
- AWS
- Box
- G-Suite
- Slack
- Zoom
Note: Salesforce data for 2017 and 2018 are the same at the time of the report, as are 2016 and 2019.
Okta Customers with Office 365 and Best-of-Breed Apps
- Number of Best-of-Breed Apps
-
0 Apps
-
1 App
-
2 Apps
-
3 Apps
-
4 Apps
-
5 Apps
-
6 Apps
Most Popular Online Learning Apps
Note: Data includes both personal and corporate apps.
Most Popular Banking and Finance Apps
Note: Data includes both personal and corporate apps.
Most Popular Hotel and Lodging Apps
Note: Data includes both personal and corporate apps.
Most Popular Airline Apps
Note: Data includes both personal and corporate apps.
Most Popular Ground Transportation Apps
Note: Data includes both personal and corporate apps.
Most Popular Travel Planning Apps
Note: Data includes both personal and corporate apps.
Customers Authenticating with Each Factor
Note: Each data point includes customers with MFA authentications within the last 30 days.
Distribution of Number of Factors
Note: Data is limited to customers with MFA.
Customers Using Each SDK Tool
Note: Data limited to customers with at least one SDK event between Jan 2018 and Oct 2019.
