


The past decade has seen dramatic changes in the business landscape, including more sophisticated cyber threats, the rise of distributed work, and smartphone saturation.
Along the way, our Businesses at Work report has tracked how workforces have adapted and the new tools they’ve adopted. Amid all this change, two constants emerge: the importance of security and collaboration tools.
Adapting to this new reality has led many organizations to adopt increasingly advanced collaboration and business operations apps and new security solutions. This simultaneous embrace of security and productivity is a major theme in the just-released 2025 edition of Businesses at Work, Okta’s annual review of the apps and technology organizations use today.
Each year, the Businesses at Work Report carefully analyzes anonymized data across thousands of customers in the Okta Integration Network (OIN), representing enterprise software decisions across all major industries and geographies. What emerges is a clear picture of the most popular and fastest-growing apps and services at organizations around the world, plus deeply informed trends and insights.
Major themes and reveals from this year’s data include
- An alarming increase in detected threats across industries
- The slow triumph of high-assurance authentication factors
- A steady rise in workflow-powered efficiency gains
- A milestone in the number of apps deployed per customer
- This year’s fastest-growing apps
Below is a quick summary of some of the high points (or explore the full report).
A decade of data: Businesses at Work turns 10
The first Businesses at Work report, issued in 2015, reflected enterprise software choices in a world that looked very different from the one we see today. A lot has changed, but some important themes persist, as a special 10-year retrospective in this year’s report makes clear.
A standout feature of our Businesses at Work reports is the fastest-growing apps ranking, which tracks year-over-year growth in app and tool deployment among Okta customers. This ranking offers a unique lens into emerging business trends and shifting priorities across industries.
When launched in 2015, the report showcased a range of tools but lacked security products. By 2016, this changed as security apps appeared, marking a shift in priorities. Security tools now account for 40% of the fastest-growing apps, reflecting businesses' response to the evolving threat landscape.
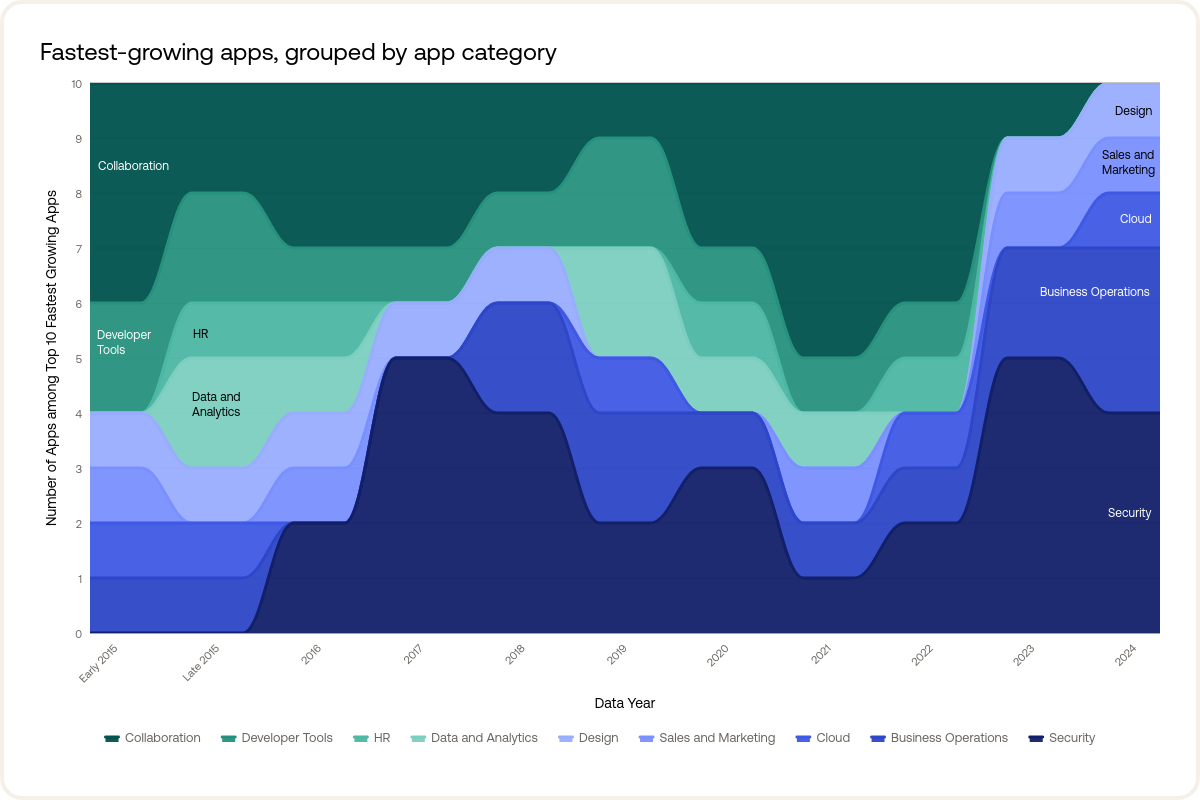
Collaboration: includes content collaboration, video conferencing, project management, productivity, and legal collaboration; Developer tools; HR: also includes employee training and learning; Design: includes wireframing and whiteboarding; Sales and marketing: also includes web hosting and social media; Data and analytics: also includes data analysis platforms; Cloud platforms; Business operations: also includes ITSM and helpdesk, integrated workspace management systems, expense management, travel, office supplies, and e-signature; Security: also includes networking & infrastructure, and data compliance
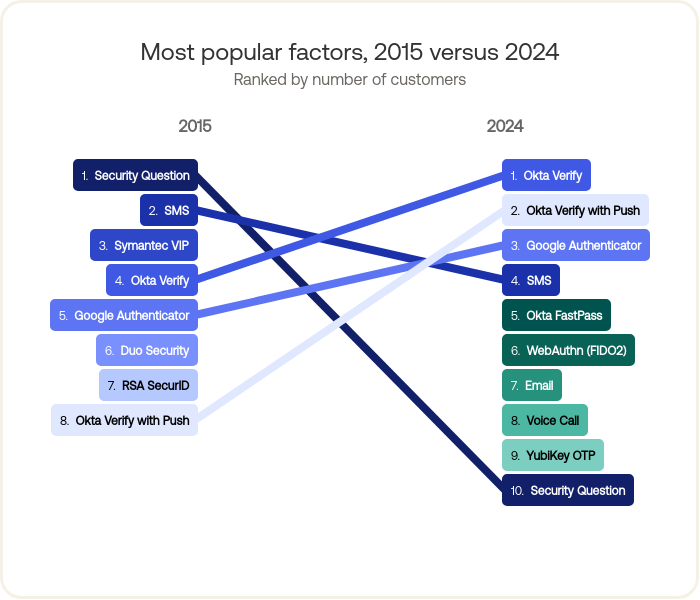
Another data point that reflects enterprises’ increased focus on security is the decline of low-assurance authentication factors. Ten years ago, low-assurance security questions were the most deployed factor. But over the past decade, customers have gradually turned to higher-assurance factors that work harder to protect their digital infrastructure.
Today, Okta Verify and Okta Verify with Push are the two most popular factors with customers, while security questions and low-assurance SMS have dropped to 10th and fourth place, respectively.
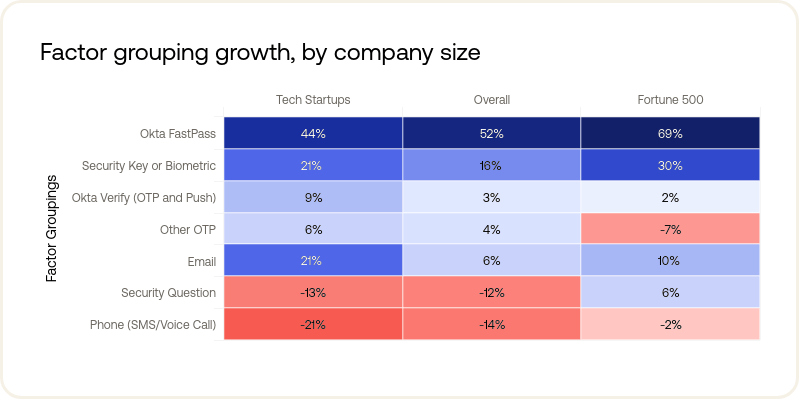
Looking at the year-over-year (YoY) growth of authentication factors, we can see that companies of all sizes are ratcheting up their deployment of high-assurance authentication factors. Fortune 500 companies are adopting the highest-assurance factors at the fastest pace (with 69% YoY growth of Okta Verify FastPass), while smaller tech startups are rapidly shedding some of the lowest-assurance factors, such as security questions and phone (SMS/Voice Call).
For more insights from our 10-year retrospective, such as the increasing dominance of security and collaboration apps, read the full report.
Cybercriminals increase their attacks — and shift targets
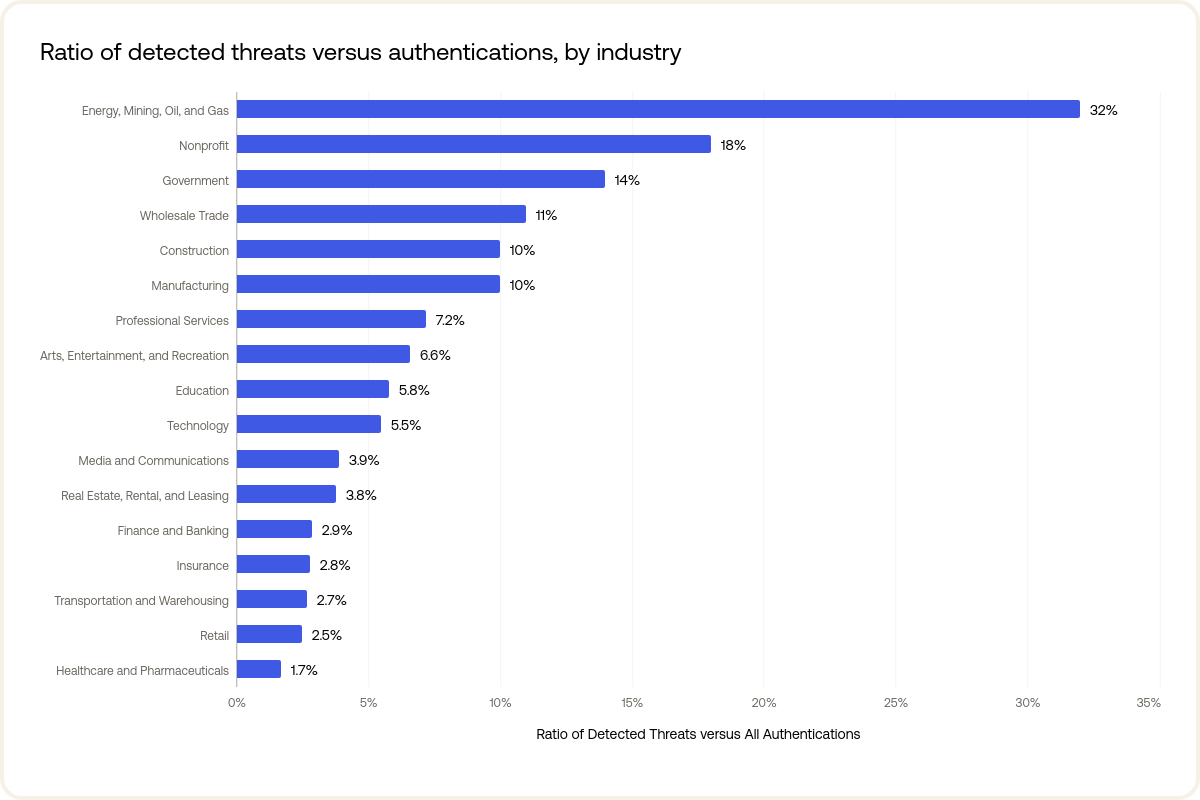
Sophisticated cyberattacks are on the rise globally. We analyzed anonymized Okta ThreatInsight data this year to understand which industries are being attacked the most and discovered that energy, mining, oil and gas is the top industry target. Our most recent data shows that nearly one in three authentication attempts in this industry are threats — an incredible tenfold increase over the previous year. Nonprofits come in second place with a still sobering 18% attack rate.
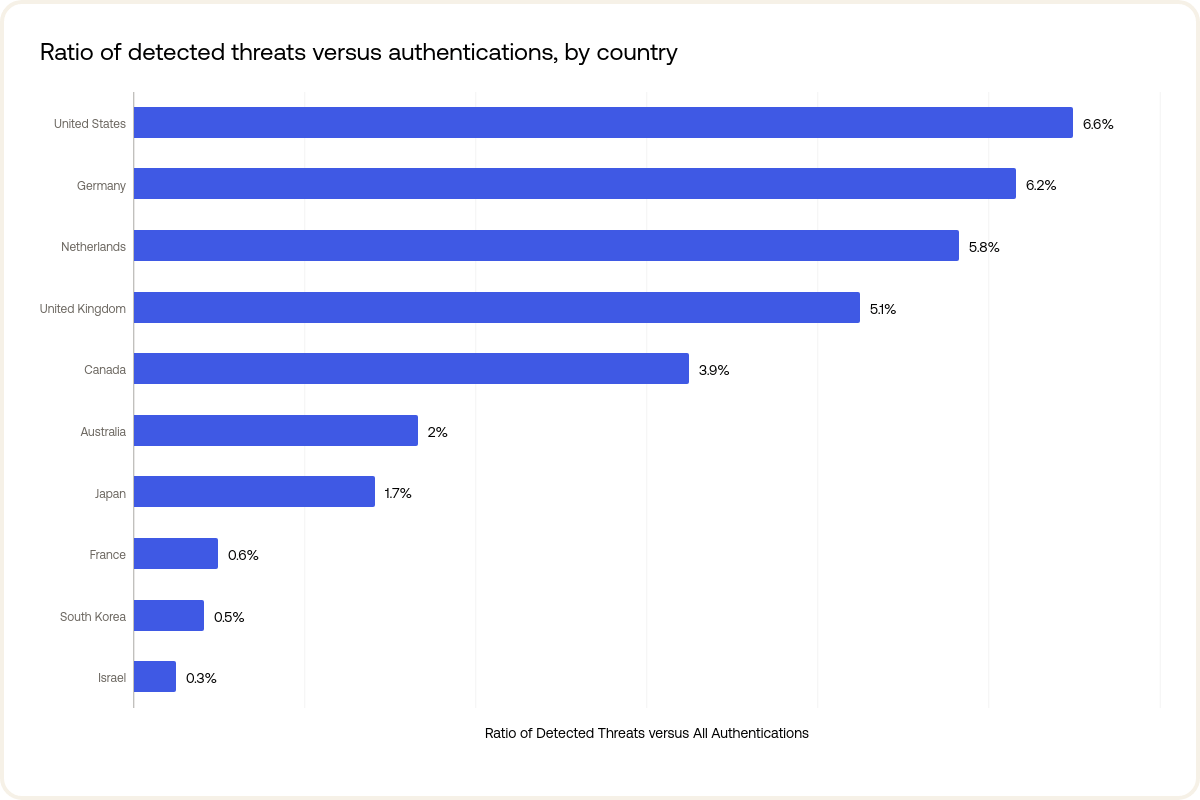
Viewed through the lens of geography, the US, Germany, and the Netherlands have the highest ratio of threats to authentications. All three had attack rates higher than 5%, representing a significant increase over the previous year. For context, Israel topped the list in the 2024 report with a rate of less than 2%. This year, that rate wouldn’t have landed it among the top five most targeted countries.
We’re deploying more apps than ever and focusing on security and collaboration solutions
The average number of apps each company uses reached 101 this year, cracking the major milestone of 100 after years of flat growth. Companies continue investing heavily in security and collaboration apps, which together make up 60% of this year’s most popular apps (the ones deployed by the most companies). In terms of the fastest-growing apps, data compliance tools continue to show significant growth this year, including Drata and Vanta (this year’s overall fastest-growing app).
For more specifics on this year’s most deployed apps and fastest-growing apps, check out the full report.
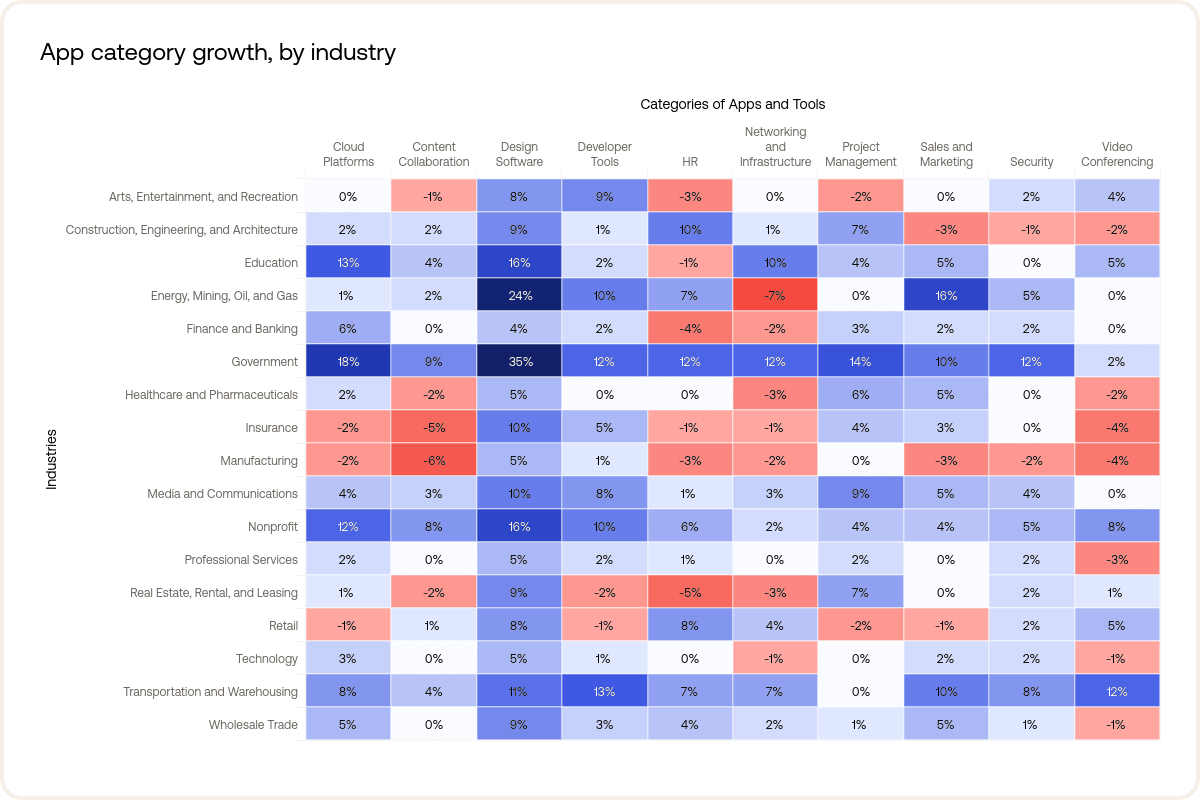
Cross-correlating app category growth with industries this year uncovered some interesting insights. Design software, last year’s darling, continues to be popular across the board: Adoption grew 7% year-over-year with particularly strong growth in government (35%) and energy (24%).
Speaking of government, the public sector was a voracious adopter of all kinds of apps and tools this year, growing in every category — in fact, by double digits in 80% of categories. On the flipside, manufacturing app adoption is shrinking or flat in nearly all categories, and adoption of video conferencing and networking and infrastructure apps is down across many industries.
Workflows are driving increased efficiency
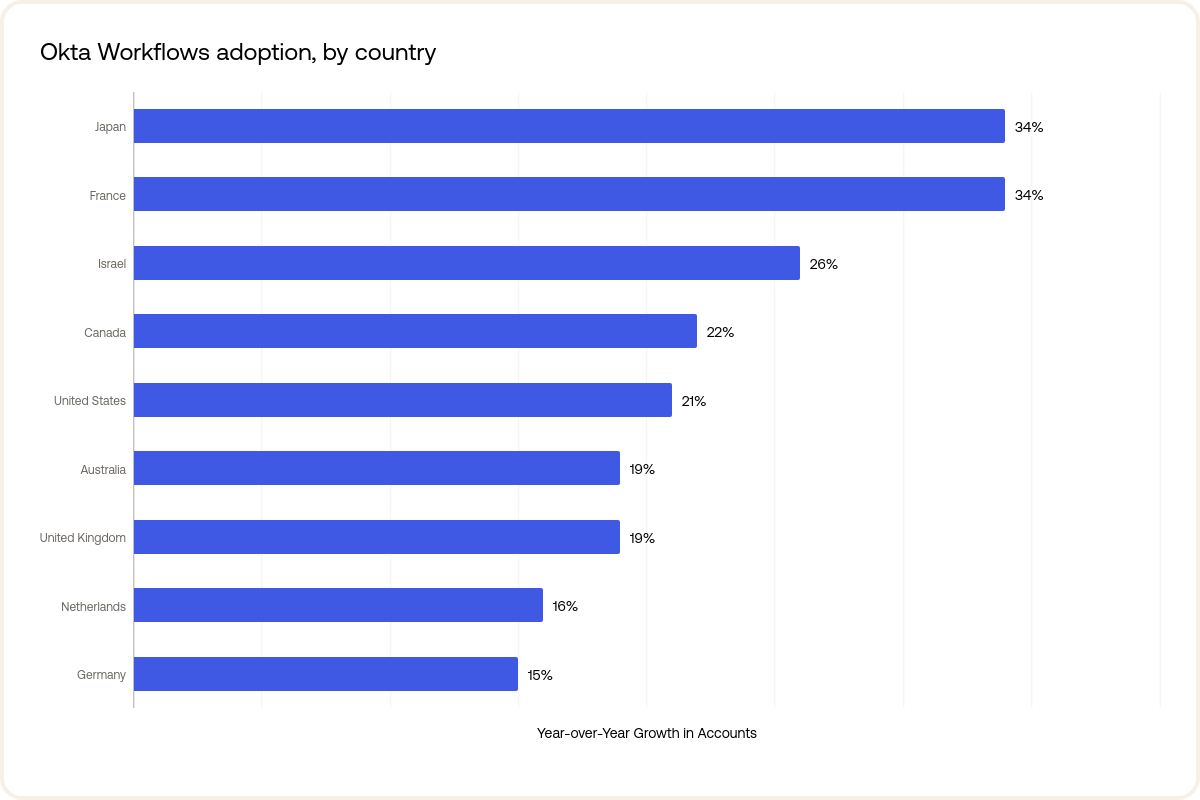
Workflow efficiency powered by AI and automation is expected to inject $15.7 trillion into the global economy by 2030. This year’s data supports this trend, and we see Okta Workflows adoption rising impressively worldwide. Japan and France lead the way, with each enjoying a 34% year-over-year increase in overall Workflows adoption; Israel comes in third place with 26% growth.
Deeply informed insights organizations can start using now
Businesses at Work has been a valuable resource for businesses for a decade, and the just-released 2025 edition reveals clear trends and opportunities that can help organizations make smarter business decisions. Read Businesses at Work 2025 to learn more.
Interested in the same insights but exclusively for nonprofits? We’ve got you covered. Don’t miss our new Nonprofits at Work report.
For a deeper understanding of how we got here, check out our previous reports:


